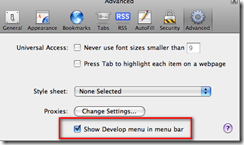
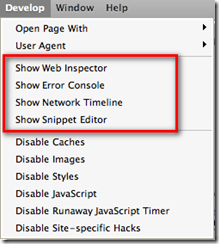
Truthfully, I had strongly considered titling this post “Drive by blogging” as a nod to a drive by shooting or “Blog rage” in deference to road rage because that’s how I felt this morning. I briefly considered “Why Safari sucks” as well. The fact is that compared to debugging under Internet Explorer or Firefox, Safari is still in the dark ages.


My issue with all this glitz is that IT’S FREAKIN’ NEAR USELESS!!! You can’t *DEBUG* JavaScript in a way that is considered modern, standard practice today. Unlike Internet Explorer with it’s developer add-in or Firefox’ Firebug add-in, you can’t set breakpoints and step through code, nor can you inspect variable values nor see a call stack to figure out where you’ve come from.
In fact, the above mentioned search yields as its number one result the Safari Developer FAQ which specifically answers the question - it’s #14 on the FAQ list. I’ll quote a bit of it here: “Safari 1.3 and above supports explicit logging of arbitrary information … by using window.console.log() in your JavaScript. All messages are routed to the JavaScript Console window and show up nicely in a dark green, to easily differentiate themselves from JavaScript exceptions.”
Gee, it bring tears to my eyes to think that 25 years ago when I first started programming in RPG II and Cobol-74 on IBM systems I could carefully insert debug logging code into my program and observe the values of variables when I re-ran the program and managed to bring it to the same state it was in that caused me to consider there’s a bug in there somewhere. It’s really great to know that the Apple team hasn’t strayed too far from the tried and true basics that have worked for so long. No wonder Safari is such a distant third in the browser market with the rest of the niche players – developers HATE working with it!!
On to my real gripe – if you really dig hard, you’ll come across the WebKit underneath Safari with instructions on how to build and debug it. There’s two itsy, bitsy things they don’t tell you in the Windows instructions…
- If you already have Cygwin for other things, forget about it. Rip it out and install their customized version mentioned in step 3. They’re not explicit about that and you will waste time otherwise. While I applaud them for making it somewhat turnkey, at least point out that they’ve got a custom configured version and that it’s the only way you’ll get it to work. Their wiki has a link to the “list” of packages (really just a pointer to the Perl source for the installer) but adding those packages to an existing Cygwin install still doesn’t work.
- The second dirty little secret they forgot to spell out…you *MUST* download the source under your home directory, e.g. /cygwin/home/<username>/WebKit. So /WebKit or /Src/WebKit, or /Repo/WebKit …none of these are allowed – there’s only one path structure that will work and it’s theirs. There’s plenty of path references inside their Perl scripts that assume this directory structure and will only work properly with it. I don’t necessarily have a problem with that, but I do have a problem with them not taking the extra minute to point this out clearly so as not to waste the time of others.
If you make either of these mistakes (or both, as I did) you will waste a lot of time and effort chasing missing things, strange error messages, and generally getting frustrated. Welcome to the wonderful world of free, open source projects – you get what you pay for…nothing!
Now on to debugging a JavaScript library that works beautifully under Internet Explorer and Firefox but not so much under he-who-must-not-be-named-browser.
P.S. Did you catch the hidden message? If you want to debug JavaScript running in Safari you need to download the source code for the browser, configure a proper build environment, then run the browser in the debugger. Ooh-rah! Only way to be productive.
No comments:
Post a Comment
Note: Only a member of this blog may post a comment.